Now we’re slightly past mid-year and time for a quick dive into the results of 2020 – winners and the rest. Back in April, I mentioned that I was a bit perplexed that reporting from the leaders in the gold mining world was only just stumbling in.
Fast forward, and I see that things have moved along with more 2020 Sustainability reports published, data workbooks compiled, and so on, well almost, one top 10 gold miner seems to still be dragging their heels (no names….🤭). As a client once commented to me, when we were late again (a Royal “we”)…. “information is useless if it comes late” – well maybe not useless, but timeliness in disclosure reporting is certainly a positive and completely reasonable to expect.
Call me old fashioned, but I like the water intensity metric*, so I took a closer look at the data. I like it because it is a good measure of performance and great for benchmarking. If miners are truly committed to working towards greater efficiency and overall using less water, then this is a good metric to consider.
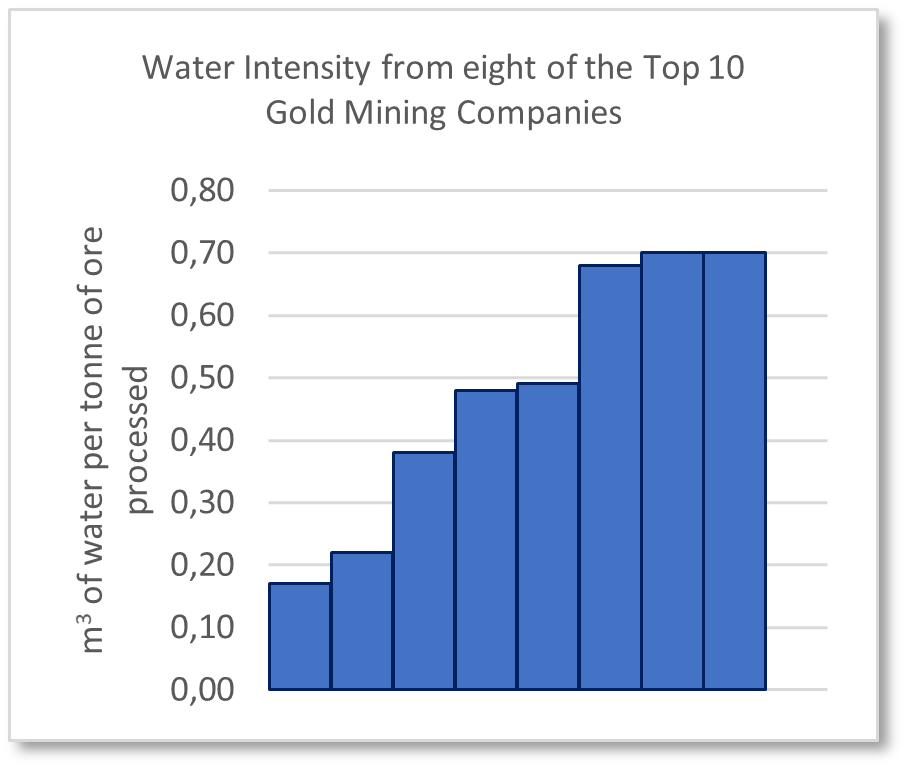
In this chart – the data is straight from the reports – we can see a total of 8 of the Top 10 mining companies reported water intensity values for 2020, missing the one miner that hasn’t reported at all so far 😒 and another who didn’t include the metric in their reports – curiously enough, ICMM suggest intensity is for internal use 🤔.
A bit of a range, but considering it is a consolidated metric for several companies, across multiple sites, climates, and settings, the numbers ain’t bad. Of course drilling down further shows an even wider range site by site, given more variables and factors that influence performance.
Details, details, details….., or better yet – context, context, context …..
Yep, the devil certainly is in the detail, for that reason I decided to make my own calculations with the data provided. All that great data, prepared according to published guidelines, should be consistent, should be straight forward right? 🤔
Well, yes, and no. Sure, the effort is certainly there, but it seems there is still a way to go on reporting consistency.
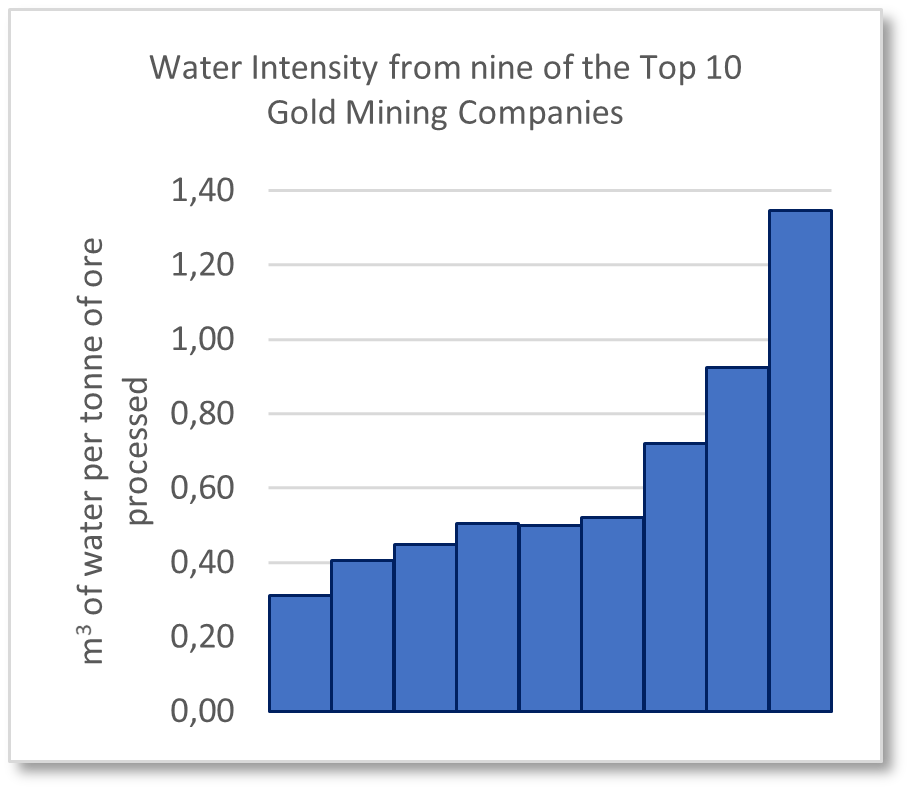
Here is my chart. Looks a bit different, a bigger spread, an apparent bigger gap between the better and the not so good. I was able to include a ninth company based on the data workbooks loaded to the websites. Hard to say where the difference lies, something not quite clear perhaps in the reported assumptions – yep, those pesky details.

And just out of curiosity, water consumed by the nine of the Top 10 gold miners in 2020
= 393 million cubic meters
And some completely useless triva (sorry, given the date ):
equivalent to 157,000 Olympic sized swimming pools
or approximately
the annual water consumption of the City of Toronto.
A really interesting piece of information from one miner’s disclosure was financial:
total water costs for 2020 = US$25.23M or around 1.2% of AISC.
It would be great to see others reporting financials around water. Probably asking for too much, but when I see that I will then obviously start asking about water value!
So to round off, in case you haven’t got it, my points here from all this are:
- Great work on the mine water disclosures, but be careful with the details
- Good progress on reporting consistency – though still seemingly work to do
- Check your numbers – are independent assurers really doing their job?
- Can we have some value reported please?
And what does this all really mean? Well, finally:
- Miners can start to bench mark their performance – some are doing better than others
- Stakeholders can really start to see how companies and operations are performing, or aren’t
- Those designing and building new mines can be challenged as to what is current, what is appropriate, and what is expected
Now to tie all this to risk and some really meaningful metrics – that is going to be interesting!
*Water Intensity: The total volume of water consumed per tonne/unit of material moved, ore mined, ore processed and/or final product – as appropriate to the operational facility. (ICMM)